Bitcoin Price Consolidation Likely to Trigger Bearish Breakdown Below $70,000

Three Things to Know
- A record theft at Binance, which the FBI tied to a North Korean hacker, has erased Bitcoin's early-week bounce.
- Bitcoin is leaning on its long-term trend line while momentum gauges still favor sellers.
- The floor that matters most sits well below $70,000, where dip buyers last stepped in with size.
Bitcoin gave back its Monday bounce as the Binance hack rattled traders. Customers kept pulling funds from the exchange, and the stablecoin freezes that followed showed how far the damage reached.
The timing is poor for bulls. Bitcoin is sitting on its most watched trend marker just as trust in exchanges fades. Traders want to know if buyers can defend this line or if the range ends in a deeper break.
A $6.3 Billion Binance Theft Drags Bitcoin Back Toward Its Crisis Lows
Bitcoin slid back toward Friday's crisis-driven lows on Monday afternoon, Nov. 2. The early-week bounce faded as traders weighed the fallout from a $6.3 billion theft at Binance. The FBI has confirmed that a North Korean hacker carried out the attack.
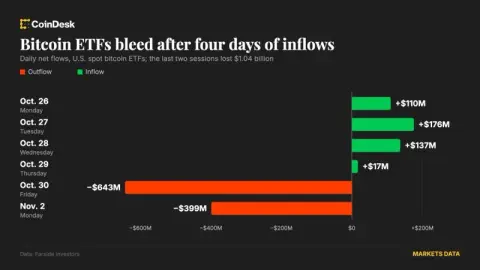
Customers are pulling money out. Net withdrawals from Binance are approaching $5 billion, and the exchange said it intends to cover the losses in full. Tether and Circle, the two largest stablecoin issuers, froze about $3 billion in tokens tied to the hack.
The damage spread to listed names. Coinbase shares fell further after Morgan Stanley downgraded the stock and slashed its price target. In Brazil, broker Mercado Bitcoin said hackers took $40 million from its hot wallets the same day. The firm said no customer funds were lost.
Risk appetite is thinning just as Bitcoin drifts toward the zones buyers defended last week.
Bitcoin Clings to Its 200-Day Average as the Bounce Fades
Bitcoin (BTC) daily price with the nearest support (green) and resistance (red). Source: TradingView
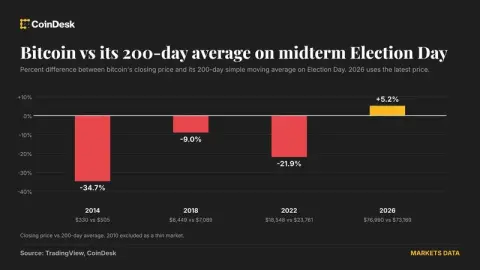
Bitcoin traded near $76,000 on Monday, flat over 24 hours. That price sits almost exactly on its 200-day moving average. A moving average smooths out daily swings by tracking the mean closing price over a set period. The 200-day line is the market's main gauge of the long-term trend.
That line matters now because it is the last major trend marker under the price. On the daily chart, there is little visible structure between here and the green support line far below. A clean close under the 200-day average would leave buyers without an obvious place to stand.
Overhead, the picture is less friendly. The 50-day moving average sits near $80,000, and Bitcoin trades below it. A price under that average usually turns the line into a ceiling. Rallies toward it tend to attract sellers who bought higher and want out at breakeven.
The recent numbers show which way the range is leaning. Bitcoin is down about 5% over the past week. Over 30 days, the loss stretches to roughly 10%. Each bounce has topped out lower than the last, and each dip has pressed closer to the long-term line.
After a slide like this, the sideways trading reads as a pause inside a downtrend. Buyers have held the 200-day average so far. They have not pushed price back toward the 50-day line, and that failure keeps sellers in charge of the tape.
Sellers Keep the Upper Hand Without Yet Hitting Exhaustion
The momentum gauges back up what the price action shows. Bitcoin's daily RSI, a 0 to 100 gauge of momentum, reads about 34. That is weak territory, but it sits above the oversold mark of 30. In plain terms, sellers have pushed hard without wearing themselves out.
That gap matters for timing. Oversold readings often come before sharp relief rallies as short sellers cover. Bitcoin has not reached that point yet, so the market still has room to fall before a reflex bounce becomes likely.
Other signals point the same way. The MACD, which compares short and longer price averages, remains below its signal line. That means downside momentum has not faded. Trend-strength readings also show sellers leading a developing trend. Until those signals turn, traders are likely to treat bounces as selling chances.
Why $65K Is the Floor That Matters Most
If the 200-day line gives way, the path of least resistance runs below $70,000. The chart shows few buyers until the first support near $65,000, where dip buyers last showed real size.
A break under that floor would change the tone. The next support sits near $62,000, and a slide there would erase most of the year's cushion above the trend line. Traders who bought the recent bounce would likely sell into weakness, adding fuel to the drop.
The upside path is harder. Bulls first need to reclaim the 50-day average zone, which has capped every recent rally. Even then, the next resistance near $82,000 stands in the way. A close above that level would undo the breakdown setup.
Two Paths for the Next 72 Hours
The next three days should settle which side controls the range.
- Bullish: Binance withdrawals slow and Bitcoin posts a daily close above the 50-day average. That would bring the next resistance into play and ease fears of a deeper slide. A daily close below the first support invalidates this path.
- Bearish: A daily close under the 200-day line opens a move toward the first support, with momentum still favoring sellers. A reclaim of the 50-day average invalidates this path and puts buyers back in control.
The Breakdown Case Has the Edge
For now, sellers control momentum, and the Binance theft has shaken trust in exchanges. A dip below that mark looks likelier than a push higher.
Speed is the main risk to that view. If Binance makes customers whole quickly, nervous short sellers could be forced to cover in a hurry.
This story was originally published by CryptoDaily. Read the original article.