Chainlink price prediction 2026-2032: A strong buy sentiment for LINK?
Key takeaways
- Chainlink could reach a maximum value of $17 in 2026.
- By 2029, LINK could reach a maximum price of $28.53.
- In 2032, Chainlink is expected to range between $21.78 and $52.95.
The Chainlink platform emerged as a prominent player in the cryptocurrency market. It provides a secure, decentralized oracle network that connects smart contracts with real-world data, influencing the current price.
As the adoption of decentralized finance (DeFi) and blockchain technology continues to grow, Chainlink’s innovative solutions have attracted significant attention from investors and traditional financial institutions alike.
Chainlink continues to expand its reach and utility across the blockchain ecosystem, showcasing its robust integration capabilities and promoting enterprise adoption across various sectors through its cross-chain interoperability protocol.
Recent updates highlight 14 new integrations of 5 Chainlink services across 10 different blockchain platforms, demonstrating its versatility across multiple blockchains, including prominent names like Arbitrum, Avalanche, and Ethereum.
These integrations enhance Chainlink’s network and solidify its position as a critical player in the interoperability and functionality of decentralized applications.
Understanding Chainlink’s potential price movements based on the information presented is crucial for making an investment decision. It involves analyzing various factors, including market trends, technological advancements, partnerships, and overall market sentiment.
This Chainlink price prediction aims to provide insights into its future performance by examining technical analysis and fundamental aspects that could influence its value.
Overview
| Cryptocurrency | Chainlink |
| Token | LINK |
| Price | $12.20 |
| Market Cap | $9.33B |
| Trading Volume (24-hour) | $281.339M |
| Circulating Supply | 766.85M |
| All-time High | $52.88, May 09, 2021 |
| All-time Low | $0.1263, Sep 23, 2017 |
| 24-hour High | $12.25 |
| 24-hour Low | $11.54 |
Chainlink price prediction: Technical analysis
| Metric | Value |
| Price Volatility (30-day variation) | 6.01% (High) |
| 50-day SMA | $12.65 |
| 14-day RSI | 39.62 (Neutral) |
| Sentiment | Bearish |
| Fear & Greed Index | 53 (Neutral) |
| Green days | 17/30 (57%) |
| 200-day SMA | $9.83 |
Chainlink price analysis
- Daily selling momentum is easing, but remains bearish.
- Four-hour RSI holds above neutral at 53.06.
- Support is $11.63–$11.68; resistance is $11.85–$12.00.
Chainlink daily price chart
As of October 29, LINK is trading near $11.724 after recovering from the $11.20 area, but it remains below the falling Bollinger middle band at $12.172. The rebound has slowed beneath $12.00, leaving the daily downtrend intact.
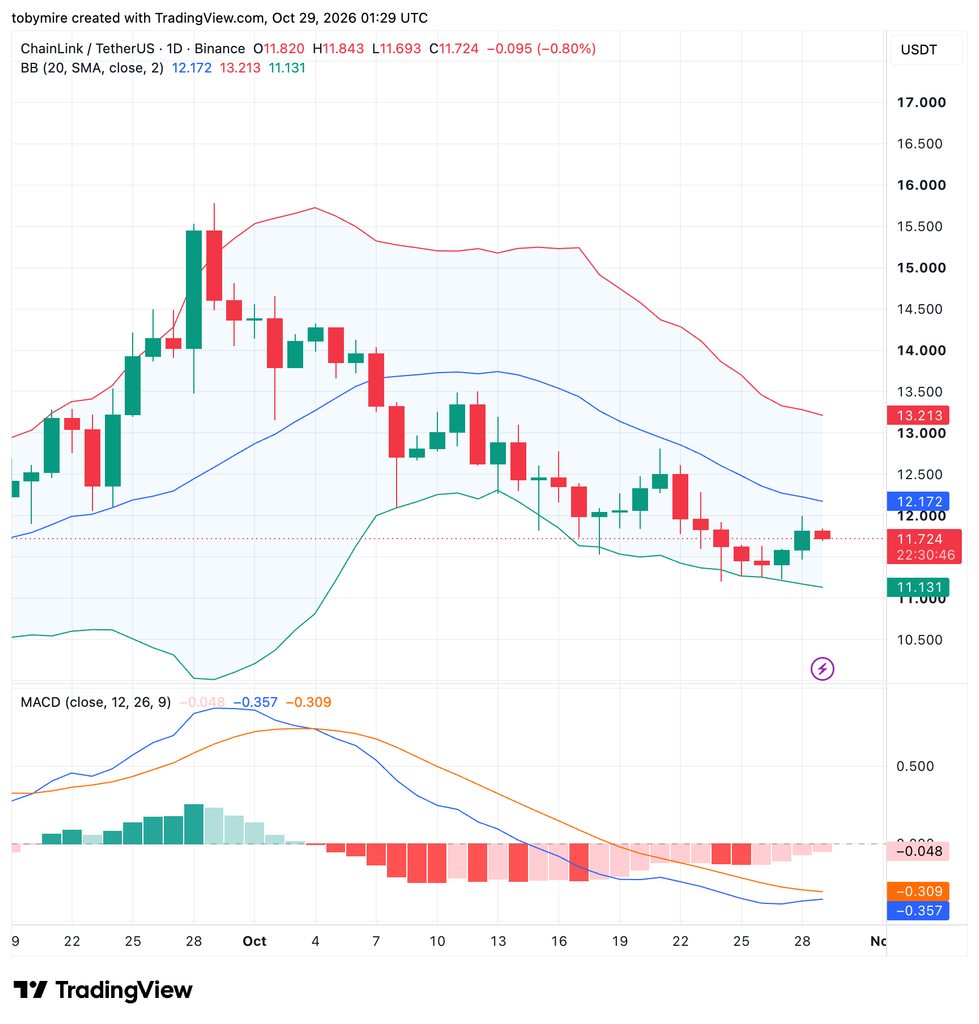
The MACD is at -0.357, below its signal line at -0.309, although the shrinking negative histogram suggests selling momentum is easing. Support lies around $11.20, followed by the lower Bollinger band at $11.131. Resistance sits at $12.00–$12.172, then around $12.50.
Chainlink 4-hour price chart
LINK is trading around $11.723 after pulling back from a brief test of $12.00. Price remains above the Alligator lines at $11.626, $11.630 and $11.682, preserving the recent recovery despite the latest selling.
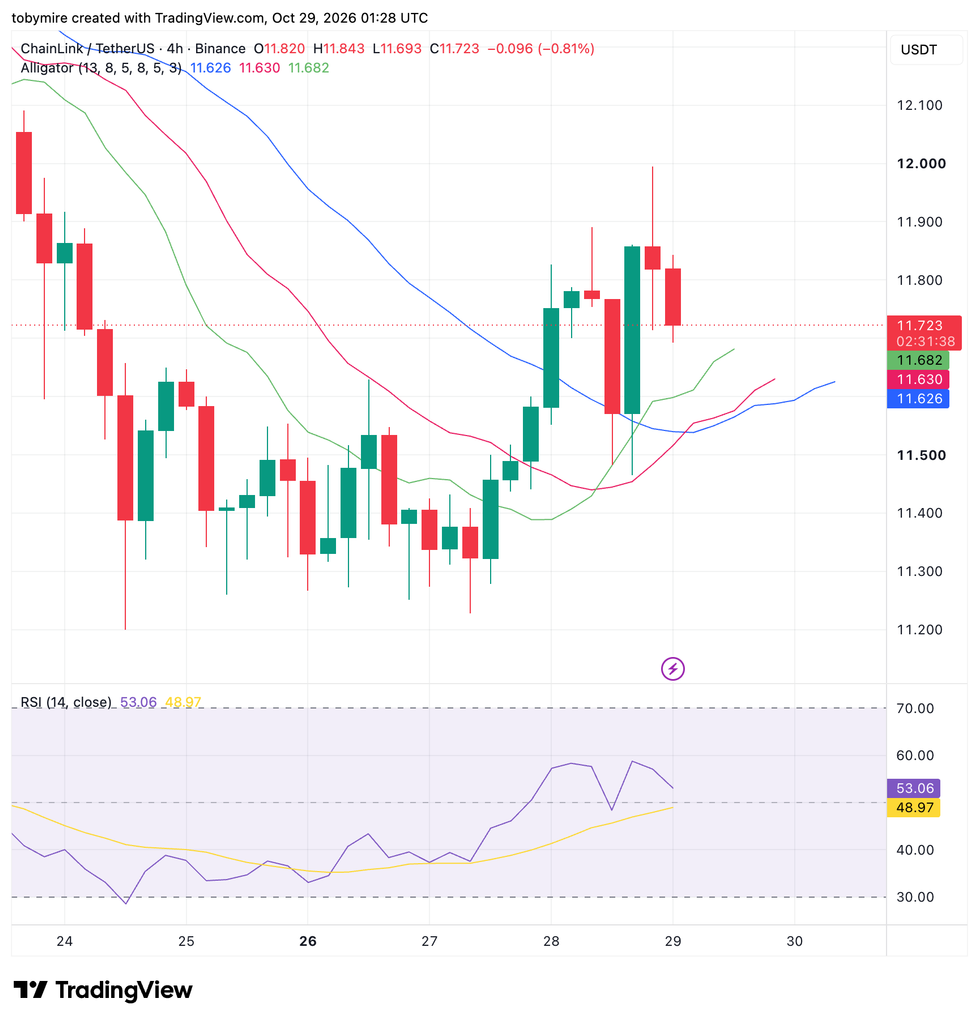
The RSI has slipped to 53.06 but remains above 50 and its average of 48.97, indicating a modest buying advantage. Immediate support lies around $11.63–$11.68, followed by $11.47–$11.55. Resistance remains near $11.85–$12.00, where the rebound recently stalled.
Chainlink technical indicators: levels and action
Daily simple moving average (SMA)
| Period | Value | Action |
|---|---|---|
| SMA 3 | $ 12.27 | SELL |
| SMA 5 | $ 12.43 | SELL |
| SMA 10 | $ 12.67 | SELL |
| SMA 21 | $ 13.47 | SELL |
| SMA 50 | $ 12.65 | SELL |
| SMA 100 | $ 10.86 | BUY |
| SMA 200 | $ 9.83 | BUY |
Daily exponential moving average (EMA)
| Period | Value | Action |
|---|---|---|
| EMA 3 | $ 12.23 | SELL |
| EMA 5 | $ 12.38 | SELL |
| EMA 10 | $ 12.69 | SELL |
| EMA 21 | $ 12.94 | SELL |
| EMA 50 | $ 12.46 | SELL |
| EMA 100 | $ 11.46 | BUY |
| EMA 200 | $ 11.13 | BUY |
What to expect from Chainlink?
LINK’s short-term recovery is holding, while the daily trend remains bearish. Staying above $11.63–$11.68 would support another attempt at $12.00, but a sustained move above $12.172 would provide stronger evidence of recovery. Losing the four-hour support area could bring $11.47–$11.55 back into focus.
Is Chainlink a good investment?
Chainlink remains a key player in the blockchain ecosystem, with growing demand for its decentralized oracle services and strategic partnerships supporting long-term adoption.
Moderate selling pressure persists, but the network’s continued utility and real-world applications suggest steady growth potential over time. Traders and investors should carefully monitor key support and resistance levels to make informed decisions and manage risk effectively.
Will Chainlink reach $50?
Based on long-term forecasts from industry experts, Chainlink (LINK) is projected to approach $50 by 2032.
Does Chainlink have a promising long-term future?
Chainlink shows signs of stabilization and potential for recovery, indicating that the token may have a bullish case and promising long-term future within the blockchain industry.
Recent news on Chainlink
Pacific Meta selects Chainlink for cross-chain connectivity
Japan’s Pacific Meta announced a partnership with Chainlink Labs on October 16, naming CCIP its preferred solution for connecting blockchains. The agreement supports Pacific Meta’s work on tokenization and blockchain adoption in Japan.
Chainlink price prediction October 2026
For October 2026, LINK is projected to trade at a minimum price of $10.50, with an average price of around $12.20 and a potential maximum price of $15.50.
| Chainlink Price Prediction | Potential Low | Average Price | Potential High |
| October 2026 | $10.50 | $12.20 | $15.50 |
Chainlink (LINK) price prediction 2026
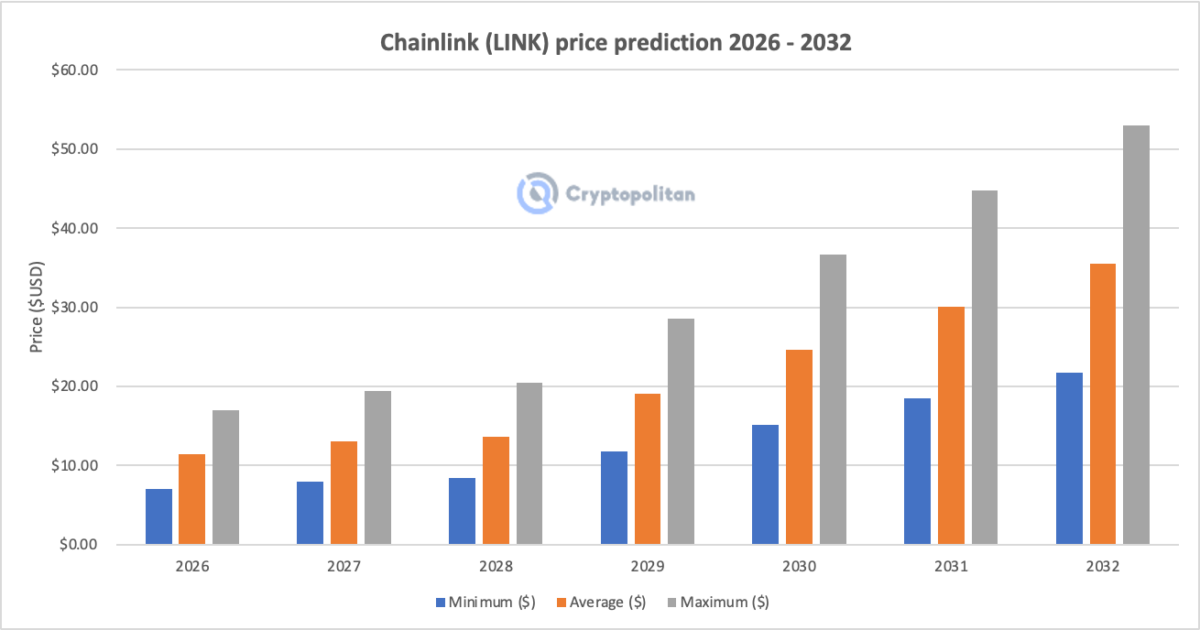
The market price for LINK is expected to reach a maximum of $17.00 in 2026. However, traders can expect a minimum trading price of $7.00, which is influenced by the overall market capitalization and external data sources. The average price of Chainlink is expected to be $11.38.
| Chainlink Price Prediction | Potential Low | Average Price | Potential High |
| Chainlink Price Prediction 2026 | $7.00 | $11.38 | $17.00 |
Chainlink price prediction 2027-2032
| Year | Minimum ($) | Average ($) | Maximum ($) |
| 2027 | 8.01 | 13.02 | 19.46 |
| 2028 | 8.40 | 13.66 | 20.41 |
| 2029 | 11.74 | 19.11 | 28.53 |
| 2030 | 15.10 | 24.57 | 36.68 |
| 2031 | 18.44 | 30.01 | 44.80 |
| 2032 | 21.78 | 35.45 | 52.95 |
Chainlink price prediction 2027
In 2027, Chainlink is expected to reach a maximum value of $19.46, a minimum price of $8.01, and an average value of $13.02.
Chainlink price prediction 2028
In 2028, LINK’s average price is expected to be $13.66; its minimum and maximum trading prices, following its historical performance, are predicted to be $8.40 and $20.41, respectively.
Chainlink price prediction 2029
The Chainlink price forecast for 2029 is a high of $28.53. It will reach a minimum price of $11.74 and average at $19.11.
Chainlink price prediction 2030
According to the Chainlink price prediction for 2030, the price of LINK will range from $15.10 to $36.68, with an average price of $24.57.
Chainlink price prediction 2031
In 2031, Chainlink prediction expects LINK to reach a maximum value of $44.80, a minimum price of $18.44, and an average value of $30.01.
Chainlink price prediction 2032
Chainlink prediction climbs even higher into 2032. According to the prediction, LINK’s price will range between $21.78 and $52.95, with an average price of $35.45.
Chainlink market price prediction: Analysts’ LINK price forecast
| Firm Name | 2026 | 2027 |
| CoinCodex | $17.81 | $ 35.34 |
| DigitalCoinPrice | $11.88 | $12.03 |
Cryptopolitan’s Chainlink price prediction
According to our Chainlink price forecast, the coin’s market price might reach a maximum value of $17 by the end of 2026. In 2028, the value of LINK could surge to a maximum price of $33.
Chainlink’s historic price sentiment
- Chainlink launched around $0.20 and stayed below $1 through 2018 before breaking above $3 by the end of 2019 as adoption of its oracle network expanded.
- LINK saw a major breakout in 2020, rallying from roughly $2 to $20 during the DeFi boom, then reached its all-time high near $52 in May 2021 before declining sharply with the broader market.
- In 2022 and 2023, LINK mostly traded between $6 and $25 as bearish sentiment dominated crypto markets. Recovery returned in 2024, with the coin climbing as high as $30.94 in December after spending much of the year fluctuating between $10 and $18.
- In 2025, LINK peaked at $22.90 in January, traded between $13 and $16 for much of the year, briefly rallied above $23 in September, and closed the year near $14.67.
- In 2026, Chainlink remained under pressure, trading between $13.6 and $14.2 in January, falling as low as $7.40 in February, and ranging between $8.29 and $10.05 in March. LINK averaged around $9 in April and traded near $9.55 in May.
- In June, LINK weakened further, trading between approximately $7.00 and $8.30. In July, it recovered modestly, trading between $7.10 and $8.90, with an average price of around $8.09.
- In August 2026, LINK rallied from around $8.16 to above $12, closing the month near $11.32.
- LINK opened September near $11.32 and closed at $14.36, gaining 26.9% after trading between $10.63 and $15.74 during the month.
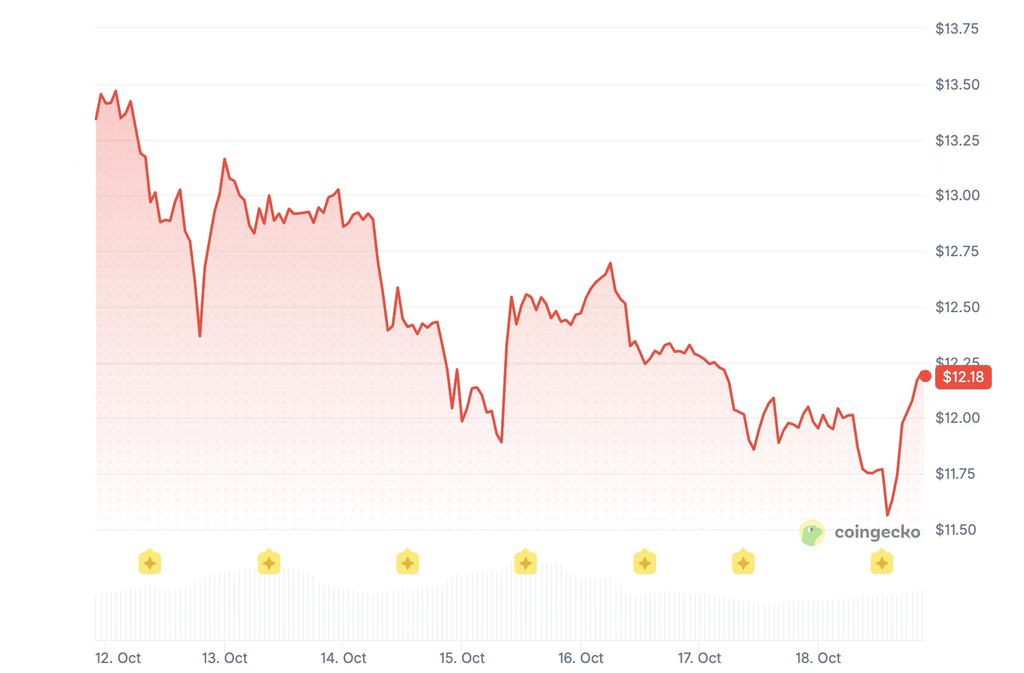
As of October 18, LINK is trading around $12.18, down 15.2% from September’s close of $14.36 and 4.6% below its October 8 price of $12.77.
This story was originally published by Cryptopolitan. Read the original article.