Is Hyperliquid Heading to $60? Analyst Flags Key HYPE Support Test
TLDR:
- HYPE trades at $84.00, down 1.80% in 24 hours and up 8.31% over seven days, with $1.1B in volume.
- A 12-hour close below the 76–78 neckline would confirm the bearish head-and-shoulders pattern.
- Downside targets sit at $62 and $59 if the neckline breaks, pointing to a possible 22% correction.
- CoinMarketCap data shows $612.39M in HYPE longs and $410.62M in shorts exposed to liquidation.
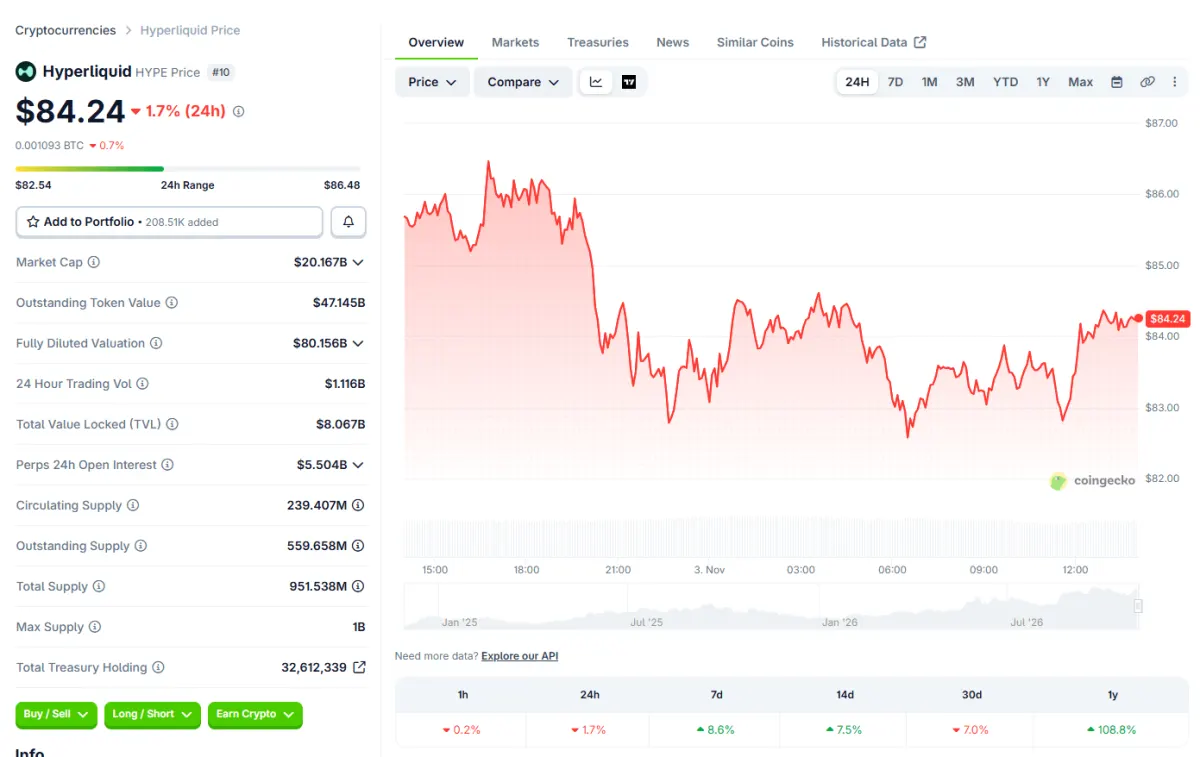
Hyperliquid is drawing attention as analysts ask whether the token is heading to $60. HYPE trades at $84.24 at the time of writing, down 1.70% over the past 24 hours.The token remains up 8.6% across the past seven days. Daily trading volume stands at $1,115,082,484.
Source: Coingecko
A potential head-and-shoulders pattern on the 12-hour chart now points to a possible 22% correction. The 76–78 neckline is now the level traders are watching closely.
Head-and-Shoulders Setup Targets $59
Analyst Ali Charts shared the setup on X about 12 hours ago. The post asks directly whether Hyperliquid is heading to $60. It describes a potential head-and-shoulders top on the 12-hour chart. The pattern forms after a seven-day gain of 8.31%.
IS HYPERLIQUID HEADING TO $60?$HYPE is forming a potential head-and-shoulders top on the 12-hour chart, pointing to a possible 22% correction.
Here's the setup I'm watching:
• Confirmation: A sustained 12-hour close below the $76–$78 neckline.
• First target: $62.
• Final… pic.twitter.com/XZtVjlEbSw— Ali Charts (@alicharts) November 2, 2026
Confirmation requires a sustained 12-hour close below the $76–$78 neckline. The neckline is the support line connecting the lows between the shoulders and the head.
A close means the candle finishes below the level, not just a brief wick through it. Until then, the pattern remains unconfirmed.
If the neckline breaks, the analyst lists two downside targets. The first target is $62. The final target is $59, which matches the 22% correction in the post.
Measured from the $76 neckline edge, $59 equals a decline of roughly 22%. Both levels sit below the current price of $84.00.
The setup also carries an invalidation level. A recovery above the right shoulder’s high would weaken the bearish case. Likewise, a bounce from 76–78 could stop the formation from playing out. The analyst is watching the neckline rather than anticipating the breakdown.
Liquidation Map Shows Leveraged Positions Near Key Levels
CoinMarketCap shared its HYPE liquidation map on X roughly 19 hours ago. Liquidation maps estimate where forced closures may cluster at different price levels.
The data shows $612.39M of Hyperliquid longs could be liquidated if the price drops. Meanwhile, shorts above the price hold $410.62M.
🎯 CoinMarketCap | Liquidation Map 🎯
$612.39M of $HYPE longs on Hyperliquid could be liquidated if the price drops.
Shorts above the price hold $410.62M.🔹 The biggest group is $37.49M of shorts at $110.15
🔹 $17.15M of longs sit 8.6% below, at $78.35
🔹 $19.4M of shorts… pic.twitter.com/OGANFS6qG8— CoinMarketCap (@CoinMarketCap) November 2, 2026
The largest cluster sits well above the market. According to the map, $37.49M of shorts are positioned at $110.15. That level lies about 31% above the current price. No other group on the map is larger.
On the downside, $17.15M of longs sit 8.6% below the price, at $78.35. This level sits close to the neckline zone cited by Ali Charts.
Therefore, a move toward $78 would test those long positions. Those percentages reflect the price when CoinMarketCap published the map.
On the upside, $19.4M of shorts sit 22.4% above the price, at $104.95. Overall, Hyperliquid longs total $612.39M against $410.62M in shorts, a gap of about $201.77M.
Price movement toward either cluster would test those leveraged positions. Price action around 76–78 will show whether the pattern confirms or fails.
This story was originally published by Blockonomi. Read the original article.