Solana Price Near $73 as Analyst Sees a Repeat of June 2026 Bottom Setup
TLDR:
- Solana price remains below the hourly SMA-20 at $73.47 and SMA-50 at $73.87, while the daily 200-period average is near $88.65.
- CoinShares sold roughly half of its Solana treasury holdings in October, generating about $2.7 million for the company’s share repurchase plan.
- Roundhill withdrew its proposed Solana and XRP covered-call ETF filings after more than a year, while BankXRP cited limited demand for comparable products.
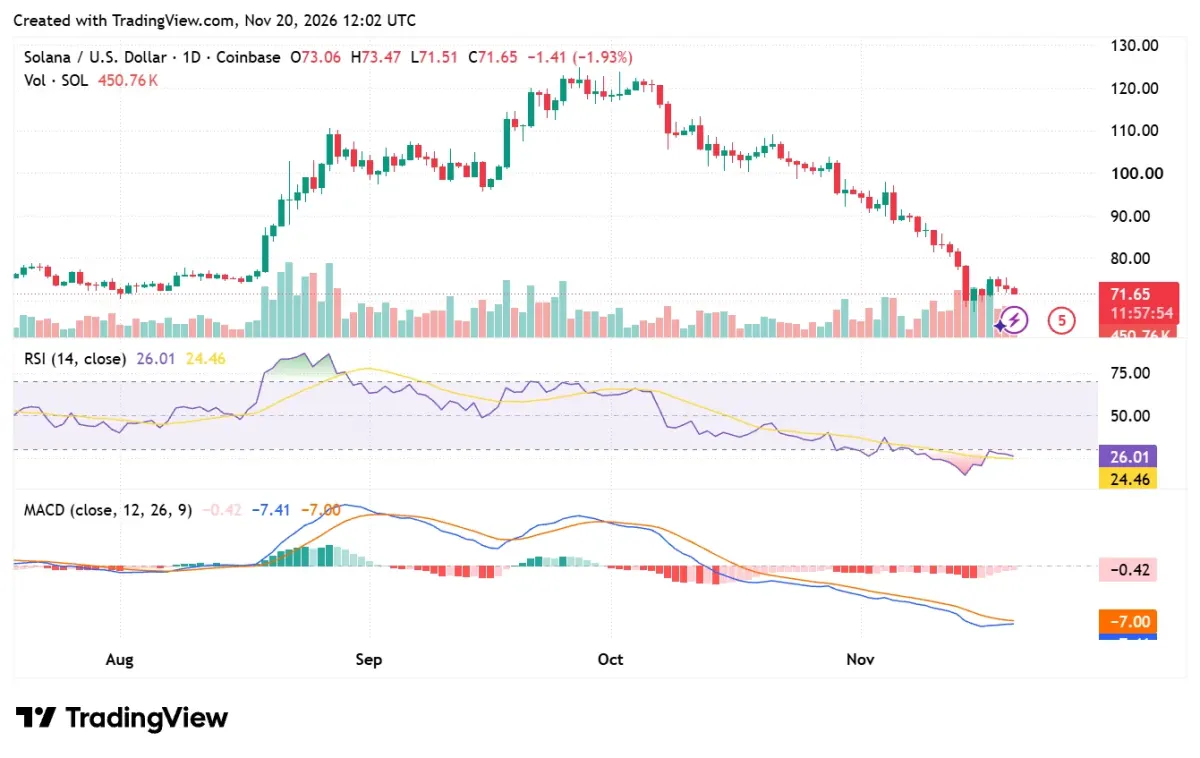
- Trader Tardigrade compared SOL’s pattern with June 2026, when price rose from around $60 to above $120; the analogy still needs confirmation at resistance.
Solana price remains under pressure despite the network’s move from mainnet beta to Solana 1.0. Institutional sales, withdrawn exchange-traded fund plans, and bearish chart signals have kept the outlook fragile. CoinShares sold about half of its Solana treasury holdings in October, according to its disclosure.
Roundhill withdrew proposed Solana and XRP covered-call ETF filings. The Solana price also sits below several moving averages, including the hourly SMA-20 at $73.47. One analyst sees a possible echo of June 2026, when a sharp decline preceded a rally. That comparison offers a scenario, not confirmation that another advance has begun.
Why Solana Price Remains Weak After the Solana 1.0 Milestone
CoinShares said it sold its Ethereum treasury position and roughly half of its Solana holdings during October. The Solana sales generated about $2.7 million, which the company directed toward repurchasing its shares. The disclosure describes a corporate capital decision; it does not establish that CoinShares expects SOL to fall. Still, the timing has drawn attention as broader digital-asset prices remain weak.
Jazzi Cooper says Evernorth has discussed putting 100 million XRP through the XRP Ledger lending protocol.
That is roughly $97M at current prices.
Other figures she cited:
Over $9B in payments on the XRP Ledger this year
Over $7B in real-world assets and stablecoins tokenized… pic.twitter.com/OlpLRULX7Q— 𝗕𝗮𝗻𝗸XRP (@BankXRP) November 19, 2026
Market participants are assessing fewer routes for exposure through proposed exchange-traded products.
Roundhill withdrew proposed Solana and XRP Covered Call Strategy ETF filings after more than a year. BankXRP said spot XRP and SOL ETFs had drawn $969 million since May, but covered-call products saw little demand. It also cited about $12 million for competing products. Demand remains subdued.
The Solana 1.0 launch marks the network’s exit from its mainnet beta designation. It marks a new development stage. Solana built infrastructure for high-throughput transactions, decentralized applications, and blockchain-based services.
The effort took several years of infrastructure development to complete. It does not, by itself, alter SOL’s market demand, remove operational risks, or guarantee stronger price action. The distinction matters because the headline upgrade and the token’s weak chart describe different things.
Solana Price Outlook Turns on Support and Moving Averages
SOL remains below the hourly SMA-20 near $73.47 and SMA-50 around $73.87. The daily 200-period SMA is higher, near $88.65. These levels show that the Solana price has not reclaimed short-term or long-term trend markers. An hourly trendline near $73.62 adds nearby resistance. A sustained move above that area could signal improving demand, but further resistance remains overhead.
Momentum indicators point to continued weakness. The MACD is negative, and the RSI at 24 places SOL in oversold territory. Oversold readings can precede a bounce, but they do not establish a bottom. The ADX, alongside bearish directional signals, indicates that the existing downtrend remains firm. Negative Bull/Bear Power readings also show sellers holding an intraday edge.
A break below daily support at $64.20 could open the door to further losses. If SOL holds there, a relief rebound remains possible. Price would still need to recover several moving averages before the chart showed a broader change in direction.
Trader Tardigrade offered a more constructive comparison on X. The analyst said SOL’s current pattern resembles June 2026, when a drop toward $60 preceded a rise above $120. That earlier sequence included a sharp sell-off, an oversold RSI, a bounce, and weeks of sideways movement before a rally. The analyst argues that the same sequence could be forming again.

The comparison is a technical interpretation, rather than proof of a repeating cycle. It describes a potential path that requires confirmation from price action. The current chart has not yet reclaimed the cited resistance around $73.62, while the $64.20 support remains important.
A break through resistance would strengthen the recovery case; a move under support would deepen the bearish setup. Solana price therefore remains at a decision point, with the network milestone unable to settle the chart’s direction.
This story was originally published by Blockonomi. Read the original article.