XRP Price Tests $0.99 Support as Analyst Flags $0.80 Risk
TLDR:
- XRP fell 14.50% in seven days and trades near $1.03 while daily volume reached $2.03B, CoinGecko reports.
- Ali Charts says XRP could fall toward $0.80 if buyers fail to defend the key $0.99 channel support level.
- Crypto With Gopal sees a potential daily double bottom near $1.00, but the pattern is still unconfirmed.
- CasiTrades points to Fibonacci support near $1.00 and fading selling pressure as possible bottom signals.
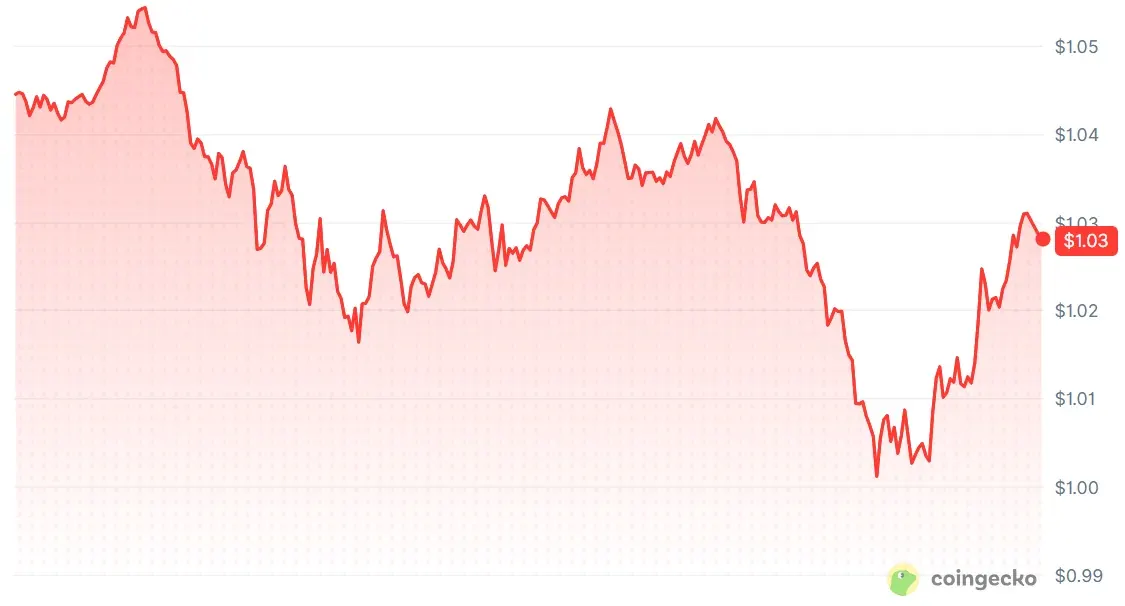
XRP is trading near $1.03 after falling 1.33% over 24 hours and 14.50% across seven days. CoinGecko data puts its 24-hour trading volume at $2,031,576,880, as the token retests support around $1.00.
Analyst Ali Charts said that XRP failed to break $1.55 resistance at the top of its trading channel. The XRP price has since reversed toward the channel’s lower boundary near $0.99. Ali warns that losing this level could expose XRP to a further dip toward $0.80.
XRP Price Returns to the Channel’s Lower Boundary
Ali Charts’ three-day chart, shared on X, shows XRP failing to clear $1.55 before reversing lower through the channel.
It marks the token near $1.03 and identifies $0.99 as the next important support level. That boundary now sits close to the $1.00 area that other analysts are monitoring.
CoinGecko’s latest figures put the XRP price around $1.03, while its 24-hour low tested the $0.99–$1.00 range. The weekly decline of 14.50% indicates that selling pressure has extended beyond a single trading session. However, current price data does not establish a sustained break below the channel’s lower boundary.
Support is a price area where buyers have previously absorbed selling. Resistance is an area where sellers have previously limited advances. Traders watch these levels because a sustained move through either boundary can change the market’s technical outlook.
XRP REVERSES ALL GAINS
It happened.$XRP failed to break above the $1.55 resistance at the top of the channel and has now completed a full reversal toward the channel’s lower boundary at $0.99.
Now, $0.99 must hold.
If XRP loses this support, the correction could extend… https://t.co/nq0F2R2a3a pic.twitter.com/hf3DPgaS9m
— Ali Charts (@alicharts) November 13, 2026
Ali Charts’ $0.80 projection depends on XRP losing support near $0.99. It is a downside scenario, not a confirmed price target or guaranteed next move.
For now, the immediate question is whether buyers can defend the area around $1.00.
XRP Price Outlook Splits Over a Potential Double Bottom
In a post on X, Crypto With Gopal says XRP is forming a potential double bottom on the daily chart.
The analyst says buyers have stepped in around the $1.00 support zone during previous tests. A double bottom develops when price tests a similar low twice, suggesting sellers may be losing control.
$XRP / USDT 🔥
XRP is printing a potential Double Bottom formation on the daily chart 👀
Price is retesting the $1.00 support zone, where buyers have stepped in before. Holding this level could trigger a bullish reversal and a fresh momentum shift 📈
A breakout above $1.70… pic.twitter.com/mcQ3UINMNK
— Crypto With Gopal (@cryptowithgopal) November 13, 2026
The pattern remains potential rather than confirmed. Gopal argues that holding $1.00 could support a bullish reversal and a shift in momentum. The analyst identifies a move above $1.70 as the breakout that could open a path toward $2.50.
CasiTrades also wrote on X that XRP may be approaching a bottom. The analyst points to Fibonacci support around $1.00 and says selling momentum is showing signs of exhaustion. CasiTrades also notes that Bitcoin is nearing major support around $69,000.
Those comments represent an optimistic interpretation, not proof that the decline has ended. They contrast with Ali Charts’ warning that a failed $0.99 support level could extend the correction. The competing outlooks leave the $1.00 area as the market’s immediate technical battleground.
The next move in the XRP price therefore depends on how it reacts around support. A sustained hold could keep the double-bottom scenario in play, while a breakdown would strengthen the bearish case.
Until either move develops, $0.99–$1.00 remains the level traders are watching most closely.
This story was originally published by Blockonomi. Read the original article.