Peter Schiff Says BTC Is in a Long-Term Bear Market as Bitcoin Trades Under $69K

Three Things to Know
- Peter Schiff said bitcoin has entered a long-term bear market after it slid back to levels last seen in August.
- Daily momentum looks deeply oversold, yet sellers still control the trend and no reversal signal has appeared.
- Support near $63K now decides whether buyers get a bounce or the rout deepens.
Bitcoin slipped below a key round number late Thursday, and gold advocate Peter Schiff quickly declared a bear market. Inflation fears, a firm dollar and a shakeup at Nvidia hit risk assets together.
The drop matters because bitcoin now trades in step with the AI trade, and index changes threaten a major corporate buyer. Traders now weigh whether stretched momentum can spark a relief rally or futures selling pushes prices lower.
Schiff Calls a Bear Market as $150 Billion Leaves Crypto
Bitcoin fell below $69,000 late Thursday for the first time since August. It dropped nearly 7% in a day and touched a low near $68,530 on Nov 13. Traders pointed to hot inflation data, a firm US dollar and turmoil in the AI trade after Jensen Huang resigned from Nvidia.
The damage spread fast. About $150 billion left crypto markets in 48 hours. Ether slipped to around $1,913 the same day.
Schiff said bitcoin trading below its November 2021 price marks a long-term bear market. Anthony Pompliano said "AI and bitcoin are one big trade now."
MSCI plans to remove Strategy, the largest corporate bitcoin buyer, from its global indexes after the Nov. 30 rebalance. Orbit Markets co-founder Caroline Mauron said that weighed on bitcoin. Strategy shares fell 7.84%.
Bitunix analyst Dean Chen said selling sits mostly in derivatives, with futures CVD deeply negative and open interest falling. Retail sentiment reads extremely bearish, and bitcoin is down about 33% in a year. Michaël van de Poppe said he is buying that fear.
Both Key Averages Now Sit Overhead
Bitcoin (BTC) daily price with the nearest support (green) and resistance (red). Source: TradingView
Bitcoin now trades near $69K, below both of its main moving averages. A moving average smooths out daily swings to show the underlying trend. The 200-day average sits around $76K. The 50-day sits slightly higher, near $78K. When price holds under both, the move looks like a downtrend.
The 50-day still sits above the 200-day, which means prices were higher only weeks ago. That points to a slide that came recently and came fast.
For buyers, the 200-day is the first ceiling to clear. Bitcoin would need to climb back above it before the trend picture improves.
The pace of losses has also picked up. Bitcoin is down about 18% over 30 days. Roughly 10% of that came in the past week alone. In plain terms, the decline is speeding up instead of fading.
Van de Poppe pointed to support just below the 200-day average as a reason to buy. Price has already broken through that zone. The floor he cited has turned into resistance.
Oversold Readings Have Not Stopped the Selling
RSI, a 0 to 100 gauge of momentum, sits near 25 on the daily chart. Readings below 30 count as oversold. That means sellers have pushed hard and fast, and stretched markets often snap back with short relief rallies.
An oversold reading shows how far the selling has gone. It says nothing about when it will stop.
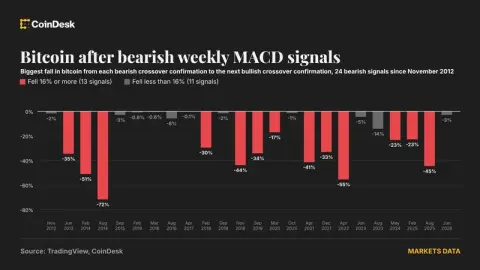
MACD, a tool that tracks shifts in momentum, still sits below its signal line. Momentum still points down, and sellers drive a strong trend. In strong downtrends, RSI can stay pinned in oversold territory for days or weeks while price keeps sliding.
Traders watching for a bounce want to see MACD curl up and cross back above its signal line. That turn would show selling pressure fading. Without it, any rebound risks stalling quickly.
Where $63K Fits Between Buyers and a Deeper Rout
The nearest support sits around $63K. That is the level buyers need to defend if the oversold stretch is going to produce a bounce. A clean break below it would open the way toward $59K.
Overhead, the first resistance comes in around $75K. That level sits just under the 200-day average, so the two form a thick band of supply. Sellers who bought higher may use any rally into that zone to get out near breakeven.
A move through that band would ease the pressure. The bigger test sits near $80K, above both moving averages. Reclaiming it would undo much of the recent damage and weaken the bear-market call Schiff made.
Relief Rally or Another Leg Down
Two paths stand out, and each has a clear line that would prove it wrong.
- Bullish: The oversold stretch produces a relief bounce. A daily close above the first resistance would be the trigger, with the 200-day average as the next target. A drop below the nearest floor would cancel this view.
- Bearish: Sellers stay in charge, and a daily close under the nearest floor opens the way to the next support below it. A reclaim of that first resistance would invalidate the bearish case.
Sellers Keep the Upper Hand for Now
The trend favors Schiff's camp. Bitcoin would need to reclaim the first resistance overhead before buyers can claim the upper hand.
Leverage remains the wild card. Selling has run through futures, so forced liquidations can deepen a drop quickly. A fresh inflation print or another jolt to the AI trade could swing bitcoin hard in either direction.
This story was originally published by CryptoDaily. Read the original article.